Debugging RxJS, Part 1: Tooling
July 05, 2017 • 7 minute read

I’m an RxJS convert and I’m using it in all of my active projects. With it, many things that I once found to be tedious are now straightforward. However, there is one thing that isn’t: debugging.
The compositional and sometimes-asynchronous nature of RxJS can make debugging something of a challenge: there isn’t much state to inspect; and the call stack is rarely helpful. The approach I’ve used in the past has been to sprinkle do operators and logging throughout the codebase — to inspect the values that flow through composed observables. For a number of reasons, this approach is not one with which I’ve been satisfied:
- I always seem to have to add more logging, changing the code whilst debugging it;
- once debugged, I either have to remove the logging or put up with spurious output;
- conditional logging to avoid said output looks pretty horrid when slapped in the middle of a nicely composed observable;
- even with a dedicated
logoperator, the experience is still less than ideal.
Recently, I set aside some time to build a debugging tool for RxJS. There were a number of features that I felt the tool must have:
- it should be as unobtrusive as possible;
- it should not be necessary to have to continually modify code to debug it;
- in particular, it should not be necessary to have to delete or comment out debugging code after the problem is solved;
- it should support logging that can be easily enabled and disabled;
- it should support capturing snapshots that can be compared over time;
- it should offer some integration with the browser console — for switching debugging features on/off and for investigating state, etc.
And some more that would be nice to have:
- it should support pausing observables;
- it should support modifying observables or the values they emit;
- it should support logging mechanisms other than the console;
- it should be extensible;
- it should go some way towards capturing the data required to visualize subscription dependencies.
With those features in mind, I built rxjs-spy.
Core Concepts
rxjs-spy introduces a tag operator that associates a string tag with an observable. The operator does not change the observable’s behaviour or values in any way.
The tag operator can be used alone — import "rxjs-spy/add/operator/tag" — and the other rxjs-spy methods can be omitted from production builds, so the only overhead is the string annotations.
Most of the tool’s methods accept matchers that determine to which tagged observables they will apply. Matchers can be simple strings, regular expressions or predicates that are passed the tag itself.
When the tool is configured via a call to its spy method, it patches Observable.prototype.subscribe so that it is able to spy on all subscriptions, notifications and unsubscriptions. That does mean, however, that only observables that have been subscribed to will be seen by the spy.
rxjs-spy exposes a module API that is intended to be called from code and a console API that is intended for interactive use in the browser’s console. Most of the time, I make a call to the module API’s spy method early in the application’s start-up code and perform the remainder of the debugging using the console API.
Console API Functionality
When debugging, I usually use the browser’s console to inspect and manipulate tagged observables. The console API functionality is most easily explained by example — and the examples that follow work with the observables in this code:
import { Observable } from "rxjs/Observable";
import { spy } from "rxjs-spy";

import "rxjs/add/observable/interval";
import "rxjs/add/operator/map";
import "rxjs/add/operator/mapTo";
import "rxjs-spy/add/operator/tag";

spy();

const interval = new Observable.interval(2000).tag("interval");

const people = interval
  .map((value) => {
    const names = ["alice", "bob"];
    return names[value % names.length];
  })
  .tag("people")
  .subscribe();
The console API in rxjs-spy is exposed via the rxSpy global.
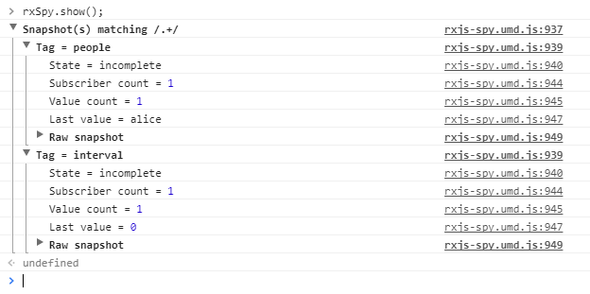
Calling rxSpy.show() will display a list of all tagged observables, indicating their state (incomplete, complete or errored), the number of subscribers and the most recently emitted value (if one has been emitted). The console output will look something like this:
To show the information for only a specific tagged observable, a tag name or a regular expression can be passed to show:
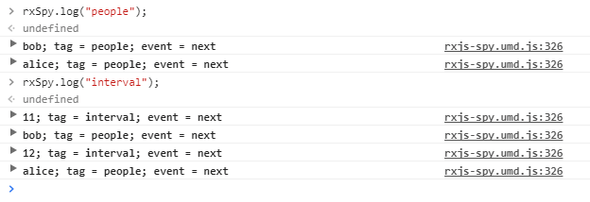
Logging can be enabled for tagged observables by calling rxSpy.log:
Calling log with no arguments will enable the logging of all tagged observables.
Most methods in the module API return a teardown function that can be called to undo the method call. In the console, that’s tedious to manage, so there is an alternative.
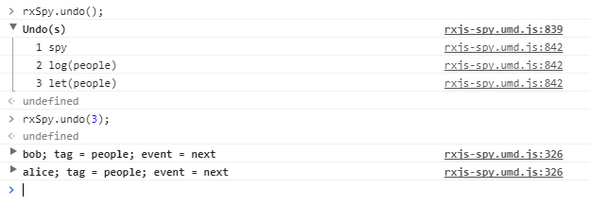
Calling rxSpy.undo() will display a list of the methods that have been called:
Calling rxSpy.undo and passing the number associated with the method call will see that call’s teardown function called. For example, calling rxSpy.undo(3) will see the logging of the interval observable undone:
Sometimes, it’s useful to modify an observable or its values whilst debugging. The console API includes a let method that functions in much the same way as the RxJS let operator. It’s implemented in such a way that calls to the let method will affect both current and future subscribers the to tagged observable. For example, the following call will see the people observable emit mallory — instead of alice or bob:
As with the log method, calls to the let method can be undone:
Being able to pause an observable when debugging is something that’s become almost indispensable, for me. Calling rxSpy.pause will pause a tagged observable and will return a deck that can be used to control and inspect the observable’s notifications:
Calling log on the deck will display the whether or not the observable is paused and will display the paused notifications. (The notifications are RxJS Notification instances obtained using the materialize operator).
Calling step on the deck will emit a single notification:
Calling resume will emit all paused notifications and will resume the observable:
Calling pause will see the observable placed back into a paused state:
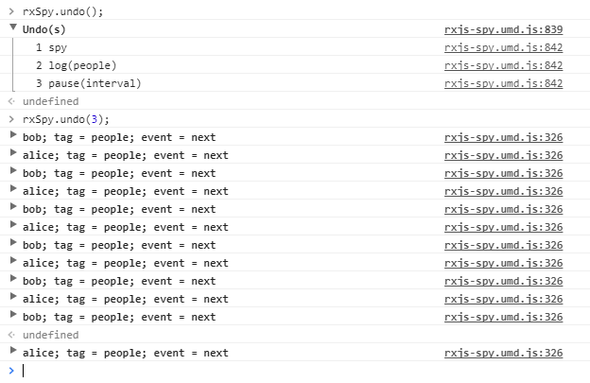
It’s easy to forget to assign the returned deck to a variable, so the console API includes a deck method that behaves in a similar manner to the undo method. Calling it will display a list of the pause calls:
Calling it and passing the number associated with the call will see the associated deck returned:
Like the log and let calls, the pause calls can be undone. And undoing a pause call will see the tagged observable resumed:
Hopefully, the above examples will have provided an overview of rxjs-spy and its console API. The follow-up parts of Debugging RxJS will focus on specific features of rxjs-spy and how they can be used to solve actual debugging problems.
For me, rxjs-spy has certainly made debugging RxJS significantly less tedious.
More Information
The code for rxjs-spy is available on GitHub and there is an online example of its console API.
The package is available for installation via NPM.
For the next article in this series, see Debugging RxJS, Part 2: Logging.


